Testing and Debugging
There are several features in Nussknacker designed specifically to ease testing and debugging; this page provides a brief explanation of how to use them.
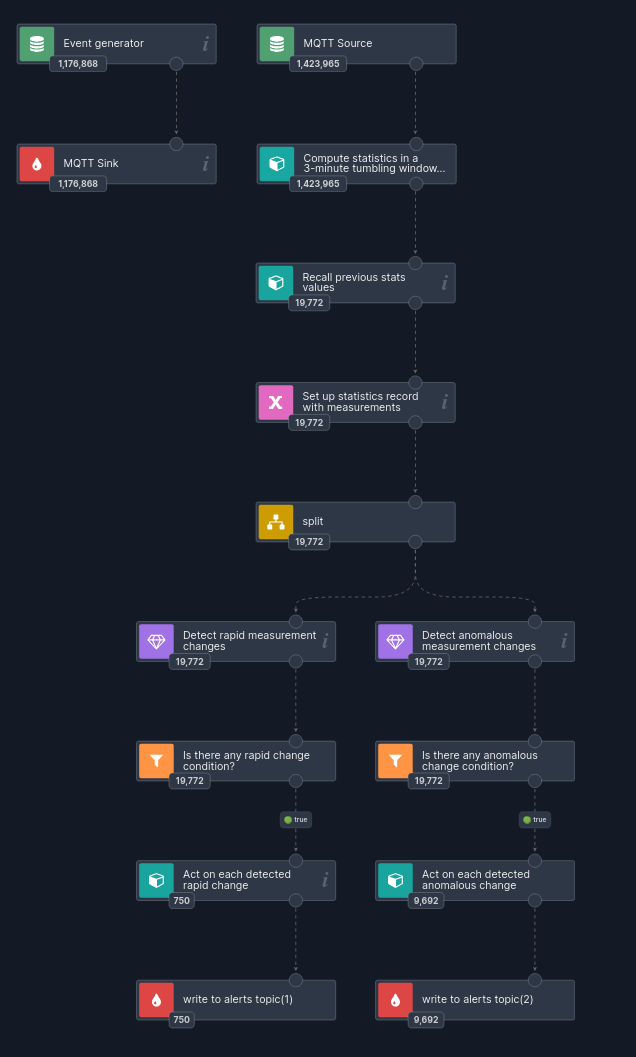
The screenshots are taken from the publicly available demo scenario. You can explore the same scenario live here (no registration required): Demo scenario link
Watching algorithm behavior with counts
Understanding how many records passed through a given node can give a good overview of how the algorithm behaves and help quickly pinpoint problematic nodes. Click counts button to see the counts snapshot in the time range of your choice. Select a refresh period to watch the counts live.

Counts reveal how many records each node has processed, making it easy to see where records are filtered out, enriched, split, or forwarded within the scenario.
Watch live data
Live data allows you to watch records as they are processed by scenario nodes. Click the live data button in the
Actions menu to activate this functionality - the icon should turn green .
If you double-click the source node, you can examine content of the records which entered the scenario (top of the left panel).
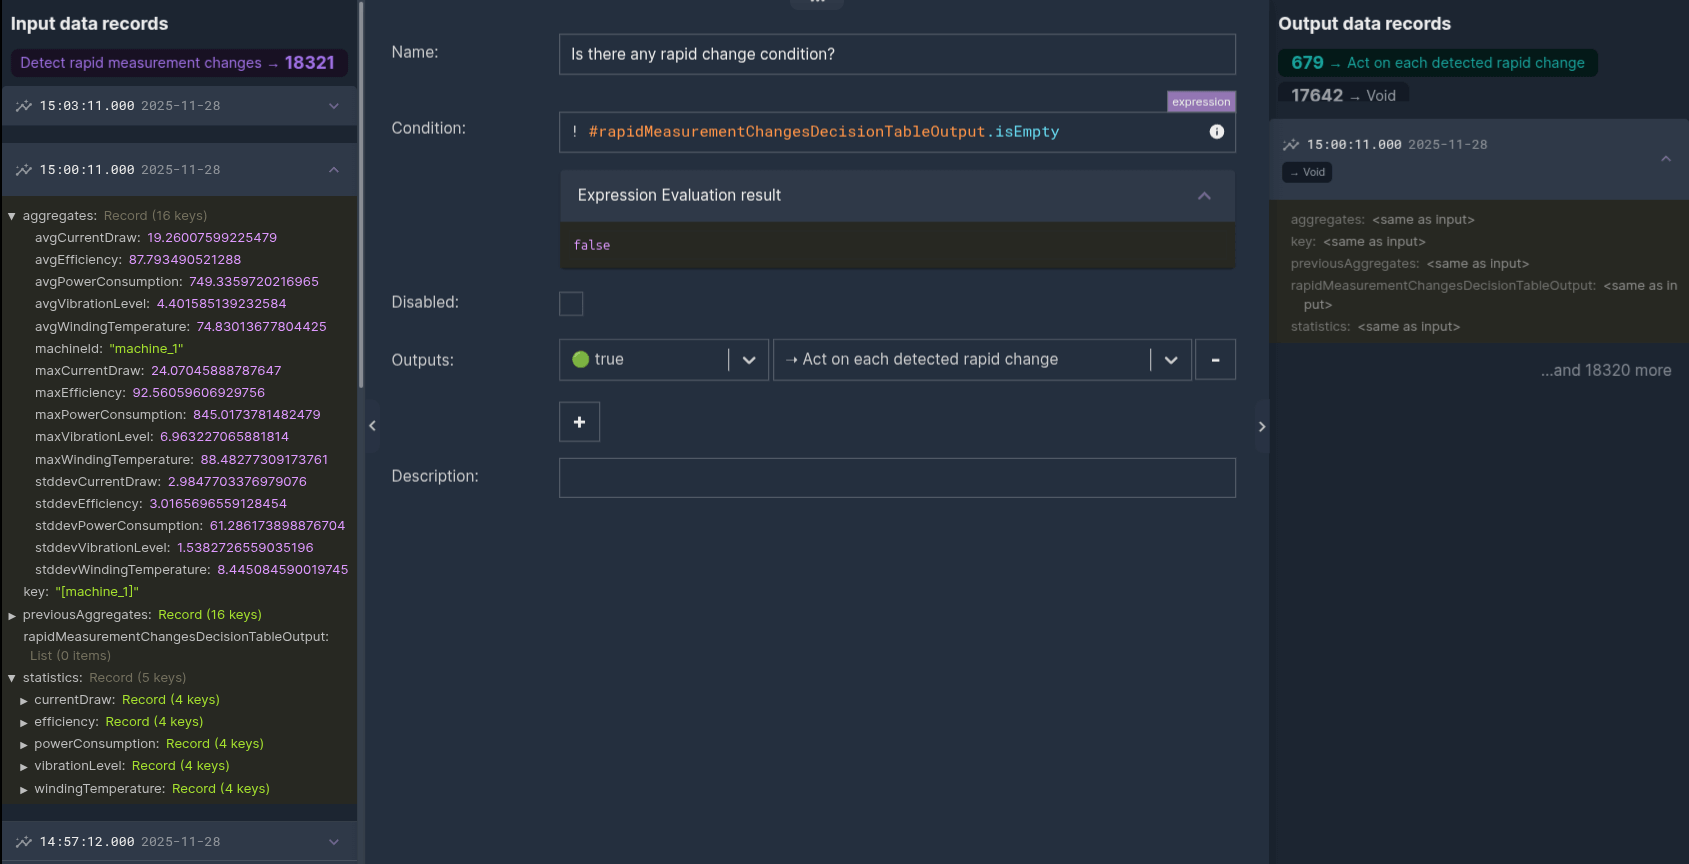
As the record traverses the scenario, additional variables can be attached to it, it can be rerouted by the Choice node, it can be filtered out or completely new records can be created. Just double-click a node of interest to you, to see how many records entered this node and - for every outgoing branch - how many left the node.
To see how the record was transformed, choose an incoming record in the left panel and examine its content (the variables) upon entry to the node. You can see how this record was transformed by the node (which variables were added) in the right panel.

Inspecting input and output records for a "Is there any rapid change condition?" node in the scenario from the previous section. 🔍 View full-size image
Testing
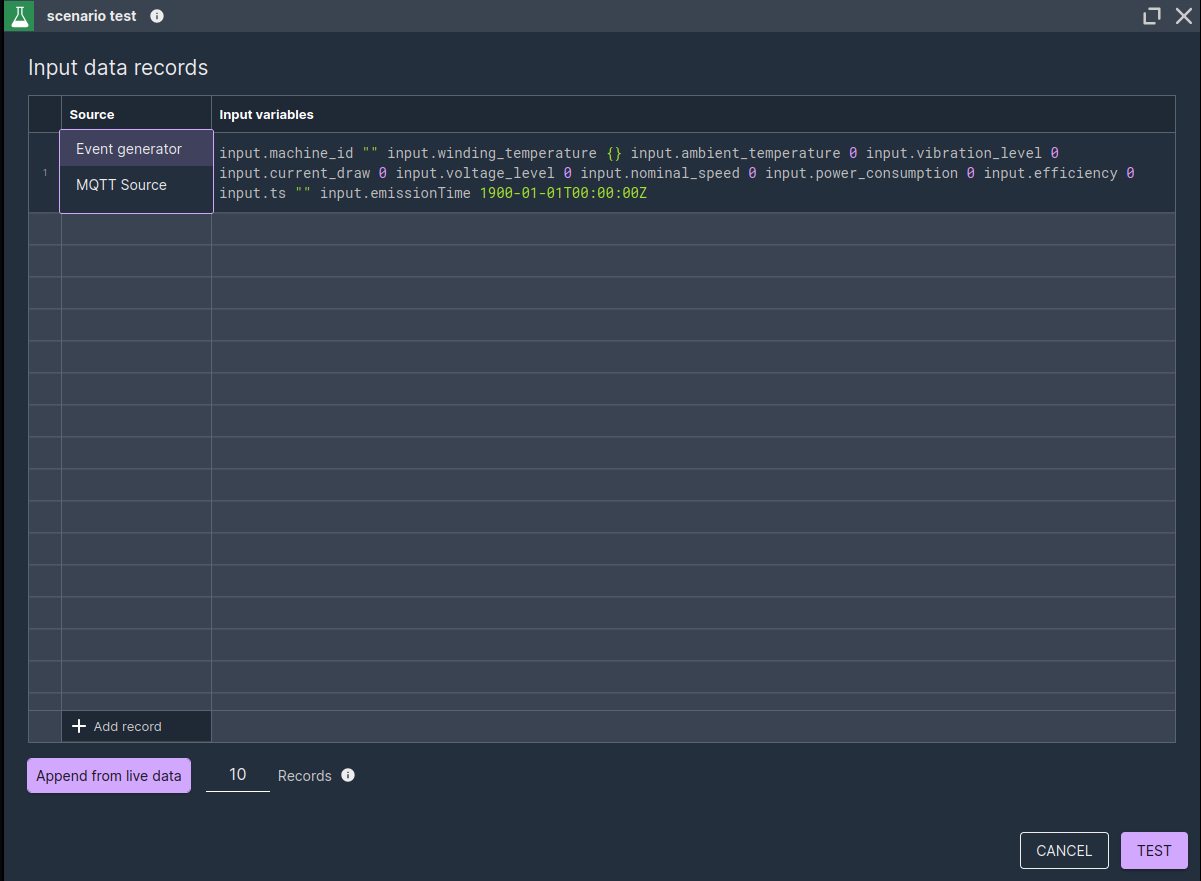
You can test your scenario with either manually entered data or with data captured during scenario execution. In both cases, click on the Test button to open the test data input form. Click
+ Add record button to manually enter test record(s).
Alternatively, click Append from live data button and specify number of records to be captured with live data.

Form used to prepare test records for scenario testing, either by manual entry or by appending records captured from live data.
The test records are displayed using the Elasticsearch way of displaying JSON objects. Once you double-click a test record, you will see an editable, formatted in a standard way, JSON object.
Your test data payload should be in the input field.
If your scenario works in the streaming processing mode, you can also define the inputMeta object content. You can find more on scenario predefined variables here.
Test cases
A single test case require one or more test records. In the Enterprise version you can define more than one test case.
Assertions
In the scenario nodes you can define assertions - statements which should be true or false when evaluated on test data. Navigate to the node's testing tab to access this functionality and enter the expressions for expected and actual values. The test records used in a particular test case are available as a list in a records variable.
When the test case is run, the assertions are evaluated and the summary per node is displayed in the node's right border.