Common Operations for Workflows
Intended audience
This manual is intended mainly for those who are going to support Nussknacker deployments (especially production ones). We assume prior knowledge of Kafka, Flink, InfluxDB, Kubernetes
The parts describing scenario management and tuning should be accessible also for those authoring them with the Nussknacker Designer.
Prerequisites
To better understand the documentation below one needs to grasp some concepts of metrics, etc. We won’t go into much detail here, only give references to worthy resources.
Some of them are external, but it also helps to read about important Nussknacker concepts in glossary and scenario authoring.
Integration with Apache Kafka
The usual way to ingest and produce events in Nussknacker is via integration with Kafka. To understand and monitor the performance of the Kafka sources it's important to know Kafka consumer details. A good explanation is available at Confluent site: Kafka consumer
Metrics architecture
In the documentation we assume standard metrics setup (available in docker-compose and Helm chart):
- InfluxDB to store and query data
- Grafana to visualize metrics
- InfluxDB reporter with Telegraf relay to deliver metrics to InfluxDB
It’s possible to configure Nussknacker installation to use other metrics setup (e.g. using Prometheus), but then you’re on your own to figure out the details - using provided metrics reporter documentation it shouldn’t be too hard.
Monitoring - metrics
Kafka cluster
Below we provide some valuable resources on how to monitor the Kafka cluster:
Upgrading to new versions
Upgrading Nussknacker
Since all scenarios are deployed to an execution engine, it's possible to first upgrade Nussknacker Designer and redeploy all scenarios with a new version in the next step.
Please see the Migration Guide before doing the upgrade - especially when using custom extensions.
Nussknacker operations REST API
Nussknacker provides a few REST endpoints which may be helpful to check if everything is OK - e.g. can be used to implement health checks using standard monitoring tools.
Below we describe endpoints that return general information about the Nussknacker state. Please see Deployment REST API section for endpoints allowing for management of a single scenario.
/api/app/buildInfo GET- returns basic information about deployed version of Nussknacker. Sample output looks like this:
{
  "name": "nussknacker-api",
  "gitCommit": "edcbd3b964e09271f54a7e5a8700c4a3e73d0275",
  "buildTime": "2026-10-09T09:42:30.748539",
  "version": "2.3.0",
  "processingType": {
    "streaming": {
      "name": "generic",
      "version": "2.3.0",
      "buildTime": "2026-10-09T09:42:30.748539",
      "gitCommit": "edcbd3b964e09271f54a7e5a8700c4a3e73d0275"
    }
  }
}
/api/app/healthCheck GET 200- use to check if Nussknacker Designer is up/api/app/healthCheck/process/deployment GET- 200 - if all deployed scenarios are running
- 500 - basic information about deployed scenarios that are not running (e.g. failed, restarting etc.)
/api/app/healthCheck/process/validation GET- 200 - if all scenarios are valid
- 500 - list of not-valid scenarios
/api/app/leader GET 200- returns whether this instance is the current High Availability leader. No authentication required, so it can be used directly by a load balancer. Sample output:
{
  "haEnabled": true,
  "instanceId": "designer-1",
  "isLeader": true
}
When HA mode is disabled, haEnabled is false and isLeader is always true.
/api/app/config GET(requires admin permissions) - serialized configuration of Nussknacker Designer and components (NOTE: configuration returned by this endpoint does not have all substitutions resolved, e.g. some environmental variables will not be returned)/api/app/processingtype/reload POST(requires admin permissions) - reload Model configuration. Used mostly if you use custom components which have dynamic configuration (e.g. list of components depend on external registry, like MLFlow or OpenAPI)
Deployment REST API
Endpoints under “admin”
/api/processManagement/deploy/{scenarioName} POST- deploy scenario with given name passed as ascenarioName/api/processManagement/cancel/{scenarioName} POST- cancel scenario with given name passed as ascenarioName. Savepoint won't be saved/api/adminProcessManagement/snapshot/{scenarioName}?savepointDir={path} POST- make a savepoint of current scenario's state. Returns path where savepoint was saved as a plain string e.g.hdfs:///flink/savepoints/savepoint-71a39f-b2078dc48f16. Can be used indeployendpoint as asavepointPathparameter/api/adminProcessManagement/stop/{scenarioName}?savepointDir={path} POST- stop scenario and make a savepoint. Returns path where savepoint was saved as a plain string e.g.hdfs:///flink/savepoints/savepoint-71a39f-b2078dc48f16. Can be used indeployendpoint as asavepointPathparameter/api/adminProcessManagement/deploy/{scenarioName}?savepointPath={path} POST- deploy scenario from given savepoint. Example savepoint path:hdfs:///flink/savepoints/savepoint-71a39f-b2078dc48f16
Designer - monitoring
Designer metrics
The Designer keeps its own metrics in a Dropwizard registry and exposes them over JMX in the designer domain.
When PROMETHEUS_METRICS_PORT is set (see environment variables),
the bundled JMX Prometheus agent serves them as Prometheus metrics under /metrics on that port.
Each metric is exported under its own name, with its tags as labels - a timer named deployments.action.duration
becomes designer_deployments_action_duration_*. The bundled agent configuration lowercases metric and label names;
the snake_case tag keys (deployment_manager_type, deployment_target, scenario_id, scenario_name) are kept as
they are and can be used in PromQL queries directly.
Deployment action metrics
The Designer times its deployment actions with the deployments.action.duration timer. In Prometheus, the timer
produces a separate series for each of its numeric attributes, for example
designer_deployments_action_duration_count. The operation tag identifies the action and the stage tag
identifies the measured part of it:
| Operation | Stage | Measured duration |
|---|---|---|
all except validate | request | The whole command, from the request to its result |
deploy, redeploy, cancel | execution | The command sent to the Deployment Manager |
deploy, redeploy | scenario_validation | Scenario validation |
deploy, redeploy | deployment_manager_validation | Deployment Manager validation |
validate | scenario_validation | Scenario validation requested by the editor |
Stages can overlap or contain other stages, do not sum them to calculate the total action duration.
A deploy or redeploy is the exception: the Designer accepts it and finishes its request before its execution starts,
so those two do not overlap - but they do not add up to the time until the scenario runs either.
Every completed timer has a result=success|failure tag and the context tags scenario_id, scenario_name,
deployment_target and deployment_manager_type. The target and the manager type use unknown when unavailable,
including when an operation fails before they can be resolved. When the target has been resolved explicitly to no
target, deployment_target is none; a resolved named target uses its name. Thus unknown means unresolved, while
none means a known absence of a target.
A cancel is measured once per deployment target at the execution stage, each with its own target and result. A
scenario cancelled without a target - because its deployments did not record one - is measured once, with
deployment_target="none". One cancel can span several targets, so its request stage reports
deployment_target="unknown".
The validate operation is not part of a deployment - it times the validation that the scenario editor asks for - so
its deployment_target is always none, while its deployment_manager_type is the one of the validated scenario.
HTTP request metrics
Every request the Designer serves is timed by the http.requests.duration timer
(designer_http_requests_duration_*), so that each backend operation - validating, saving, testing or deploying a
scenario - has its own count and duration. The timer carries three tags:
| Tag | Value |
|---|---|
method | the HTTP method of the request |
endpoint | the route that handled the request, as a path template |
status | the HTTP status code the request was answered with |
Every request is measured with the status code it was finally answered with, whether a route produced it or the Designer answered without reaching one: a 401 or 403 for a request that may not be served, a 404 for a path nothing matches, a 405 for an unsupported method, a 500 for a request whose handling failed.
The endpoint tag is always a template and never the requested path, so that the number of series stays bounded no
matter which paths are requested:
endpoint | Meaning |
|---|---|
/api/nodes/{scenarioName}/validation | the path template of the endpoint that handled the request |
/api/processValidation/{rest} | a route that does not publish a template yet, named after its resource |
unrouted | a request under /api that no route answered - its status says why |
static | anything outside /api: a file of the frontend, or a path nothing served |
Scenarios - monitoring and troubleshooting
Each scenario has its own performance characteristics and considerations. This section describes common ways to monitor the health of a running scenario and how to handle common problems. Most of the sections are aimed not only at operations people but also at (especially advanced) editors of Nussknacker scenarios.
Nussknacker metrics
One of the crucial aspects of running production workloads is monitoring. In this section we'll explain how the Nussknacker scenario running on the execution engine gives rise to certain metrics, how to process them and display them in Grafana.
Metric types
Below we describe common
| Name | Fields reported (with InfluxDB) | Description |
|---|---|---|
| counter | count | |
| histogram | count, max, mean, min, p50, p75, p95, p98, p99, p999, stddev | mainly used for measuring invocation times |
| gauge | value | value in given point in time |
| instantRate | value | special gauge for measuring throughput in given moment (standard meter has only mean throughput in 1, 5 or 15 minutes) |
Common metrics
| Measurement | Additional tags | Metric type | Notes |
|---|---|---|---|
| nodeCount | nodeId | counter | used e.g. by count functionality |
| error.instantRate | - | instantRate | |
| error.instantRateByNode | nodeId | instantRate | nodeId is unknown if we fail to detect exact place |
| service.OK | serviceName | histogram + instantRate | histogram of successful invocation times |
| service.FAIL | serviceName | histogram + instantRate | histogram of successful invocation times |
Streaming metrics
| Measurement | Additional tags | Metric type | Description |
|---|---|---|---|
| source | nodeId | instantRate + counter | |
| eventtimedelay.histogram | nodeId | histogram | only for sources with eventTime, measures delay from event time to system time |
| eventtimedelay.minimalDelay | nodeId | gauge | time from last event (eventTime) to system time |
| end | nodeId | instantRate + counter | for sinks and end processors |
| dead_end | nodeId | instantRate + counter | for event filtered out on filters, choices etc. |
Each of these metrics comes with the tags specific for execution engine:
Nussknacker comes with a Grafana dashboard; you can use it or extend/modify according to your needs.
Monitoring - is my scenario doing well?
The two most important things that should be monitored after deployment of a scenario are:
- Error rates - are there any problems with execution?
- Performance - is scenario processing events fast enough?
Error rates
When you see errors in monitoring, like on screen below:
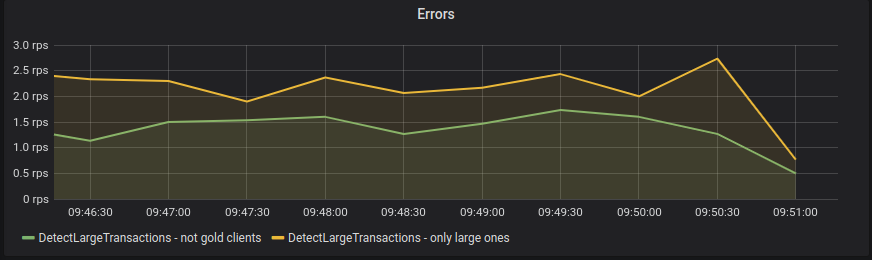
it means that there were failures during scenario execution - most often they are caused by errors during SpeL expression evaluation, which couldn't be detected during scenario authoring.
Checking source lag
There are two types of metrics that can give useful information about potential Kafka lags
- How large is lag on Kafka source partitions
- How much time has passed since the last processed event
Please note that:
- Kafka lag is reported with some delay (offsets are not committed immediately). It’s normal to have temporary spikes.
- Large differences between slots in lag may point to data skew or e.g. problematic data for some keys
Logs
If errors occur, their details can be found in one or more logs:
- engine log which contains stdout of the engine process
- in the streaming processing mode a dedicated Kafka topic can be configured where additional error details will be written.
- if Flink engine is used, additional logging mechanisms can be configured - the logs will be viewable via Flink console.
None of these logs is viewable via Nussknacker Designer - please consult your IT operations personnel on how to access the above mentioned logs.
Log examples
- Engine log
2021-06-24 07:43:32,071 INFO pl.touk.nussknacker.engine.spel.SpelExpression [] - Expression evaluation failed. Original #client.status != "GOLD", ctxId: DetectLargeTransactions-kafka-registry-typed-json-1-3847, message: EL1021E: A problem occurred whilst attempting to access the property 'status': 'Cannot invoke method/property status on null object'
- Contents of configured errors' topic on Kafka:
{
  "processName": "DetectLargeTransactions",
  "nodeId": "only large ones",
  "message": "Expression [20 / (#input.amount % 4) > 0] evaluation failed, message: / by zero",
  "exceptionInput": "20 / (#input.amount % 4) > 0",
  "inputEvent": null,
  "stackTrace": "pl.touk.nussknacker.engine.spel.SpelExpressionEvaluationException:... 34 more",
  "timestamp": 1624863781881,
  "host": "0bda71c51449",
  "additionalData": {}
}
NOTE: processName means scenario name in the above configuration.
Handling typical scenario errors
The most common problems are:
- NullPointerException - please see SpEL documentation [link Safe Navigation] to see how to check if some value is null
- Conversion errors - e.g. #NUMBER.toNumber - this usually indicates problem with the source data
- Avro serialization - see next section for more details
Avro serialization problem
Common problem is when your Avro data encoding not correspond with the one Nussknacker expects. You will find then Unknown magic byte! error indicating that data you produced to the topic are not serialized properly.
2022-03-30 14:12:28.034 [worker-DetectLargeTransactions-1] INFO p.t.n.e.u.e.DefaultWithExceptionExtractor - Unknown exception IllegalArgumentException:Unknown magic byte! for DetectLargeTransactions-kafka-avro-127
Check Schema Registry + Avro serialization part for explanation.
High Availability (HA)
By default, the Designer runs as a single instance. In High Availability mode you can run several Designer instances concurrently, so that the Designer stays available when one of them fails, restarts or is redeployed.
HA mode is opt-in and disabled by default - existing single-instance deployments require no changes.
How it works
All instances serve UI and API traffic (user actions such as editing, validating or manually deploying
scenarios work on every instance). Background operations that must run only once at a time are performed by a
single instance - the leader. The leader is chosen automatically through a shared lock stored in the
database. The leader periodically renews a time-limited lease; if it stops renewing it (for example because
it crashed or lost connectivity), the lease expires and another instance takes over. Failover is therefore
automatic, but coordinated background work may pause for roughly ha.leader.leaseDuration while the new leader
is elected.
Requirements
- PostgreSQL as the Designer database. All instances must point to the same database.
- All instances should run the same Nussknacker version and share the same configuration, except for a unique
ha.instanceId.
Enabling HA
Set ha.enabled = true and give each instance a unique ha.instanceId (it defaults to the hostname, which is
usually already unique). See the full list of options and their defaults in
High Availability configuration.
Minimal example:
ha {
  enabled: true
  # instanceId: "designer-1"   # optional, defaults to the hostname
}
Deployment topology
- Run two or more Designer instances, all pointing to the same PostgreSQL database.
- Put a load balancer in front of them. All instances serve requests, so you can balance traffic across all of them.
- Use the
/api/app/leaderendpoint if you want the load balancer (or your monitoring) to know which instance is currently the leader.
The defaults suit most deployments; see the configuration table for the available tuning options (heartbeat interval, lease duration, lock timeouts) and their constraints.
General production readiness checklist
Nussknacker configuration
- Configure restart strategy and error handler
- By default, scenarios are not restarted, so that errors do not go unnoticed
- Kafka exception handler should be used in production - configure error topic, with long enough retention
- Check if Nussknacker has access to all needed services:
- Flink REST API
- K8s REST API
- Savepoints location
- Schema registry - to detect data types
- Kafka cluster - to be able to generate test data
- InfluxDB - to have access to counts data
- Test correctness of the configuration
- Perform a few test scenario deployments, try also redeployment to check if savepoints are accessible
- Generate test data from some Kafka topic
- Check if counts can be accessed
- See if metrics links are working properly
- Make sure to configure RocksDB properly (e.g.
rocksdb.enable) - in case of Flink execution engine - For high availability of the Designer, consider running it in HA mode (requires PostgreSQL)
Setup metrics/alerting
- Prepare dashboards/alerts for monitoring cluster health, according to your needs.
- Setup healthchecks, based on Nussknacker API